Experiments in Open Data

What started as playful tinkering with some open data has turned into a web application receiving almost 70,000 visits per month and a fertile space for testing new ideas.

Property Price Paradise

Remember a time when figuring out the sale price of a property in Ireland was complete guesswork? Who could you trust to find out the real value of property in the open market? You certainly couldn’t ask the estate agents who were financially motivated to secure higher prices for their clients. The individuals who were buying and selling usually wanted to keep their cards close to their chest. We had a completely opaque market that used to drive people bananas!

The introduction of the Property Price Register in 2010, therefore, was a welcome relief. We now had regularly published prices of all property being sold on the market in Ireland.

We began to see the data from sales flowing in to the Property Price Register and it struck us here in Xwerx that this could potentially over time become an interesting data source for research, analysis and exploration.

A new playground

We began to explore the data. Our team found themselves with a project that acted as an internal hackathon, a risk-free playground where they could try out new technologies and ideas. Slowly, over time, a functioning beta began to evolve.

Proper.ie was born.

We focussed initially on how we could parse the data to reveal some of its hidden depths. The objective of the primary data source on the Property Price Register is solely to publish sale prices. Useful, transparent and up-to-date … but limited. 

If we could interrogate and organise the data more efficiently, we could add value and help people to identify trends, patterns and anomalies. Underpinned by Python, a simple, easy-to-learn programming language that emphasises readability and reduces the cost of program maintenance (perfect for an application that would move between developers over time), we combined Pandas and Fuzzywuzzy to begin working the data.

These two libraries allow us to cleanse and organise data that is being manually entered into the register on an ongoing basis. We standardise and reformat the address entries, identify geographical areas for comparative purposes and flag any potential errors we might encounter like very high or very low sale values.

Adding value to the data

Once we had tamed the data, we could begin to shape it and reveal the comparative insights hidden beneath the surface. 

We felt it would be interesting to help our audience see patterns of activity at local and county level so we built comparative charts that compiled sales data for a 12 month period across the country, showing price and sales volume trends. We interrogated the search queries that our audience were submitting and created a “Popular this Week” section that provided shortcuts into the townloads that were trending on the site.

We had enough in place now to start some user test sessions to evaluate what we were creating and to determine what new features needed to be considered.

Off these, we added an email alert system to allow the audience sign up for a regular alert for their chosen areas, built a single page overview of all counties and made a series of technical changes to boost performance and speed up page load.

property sold

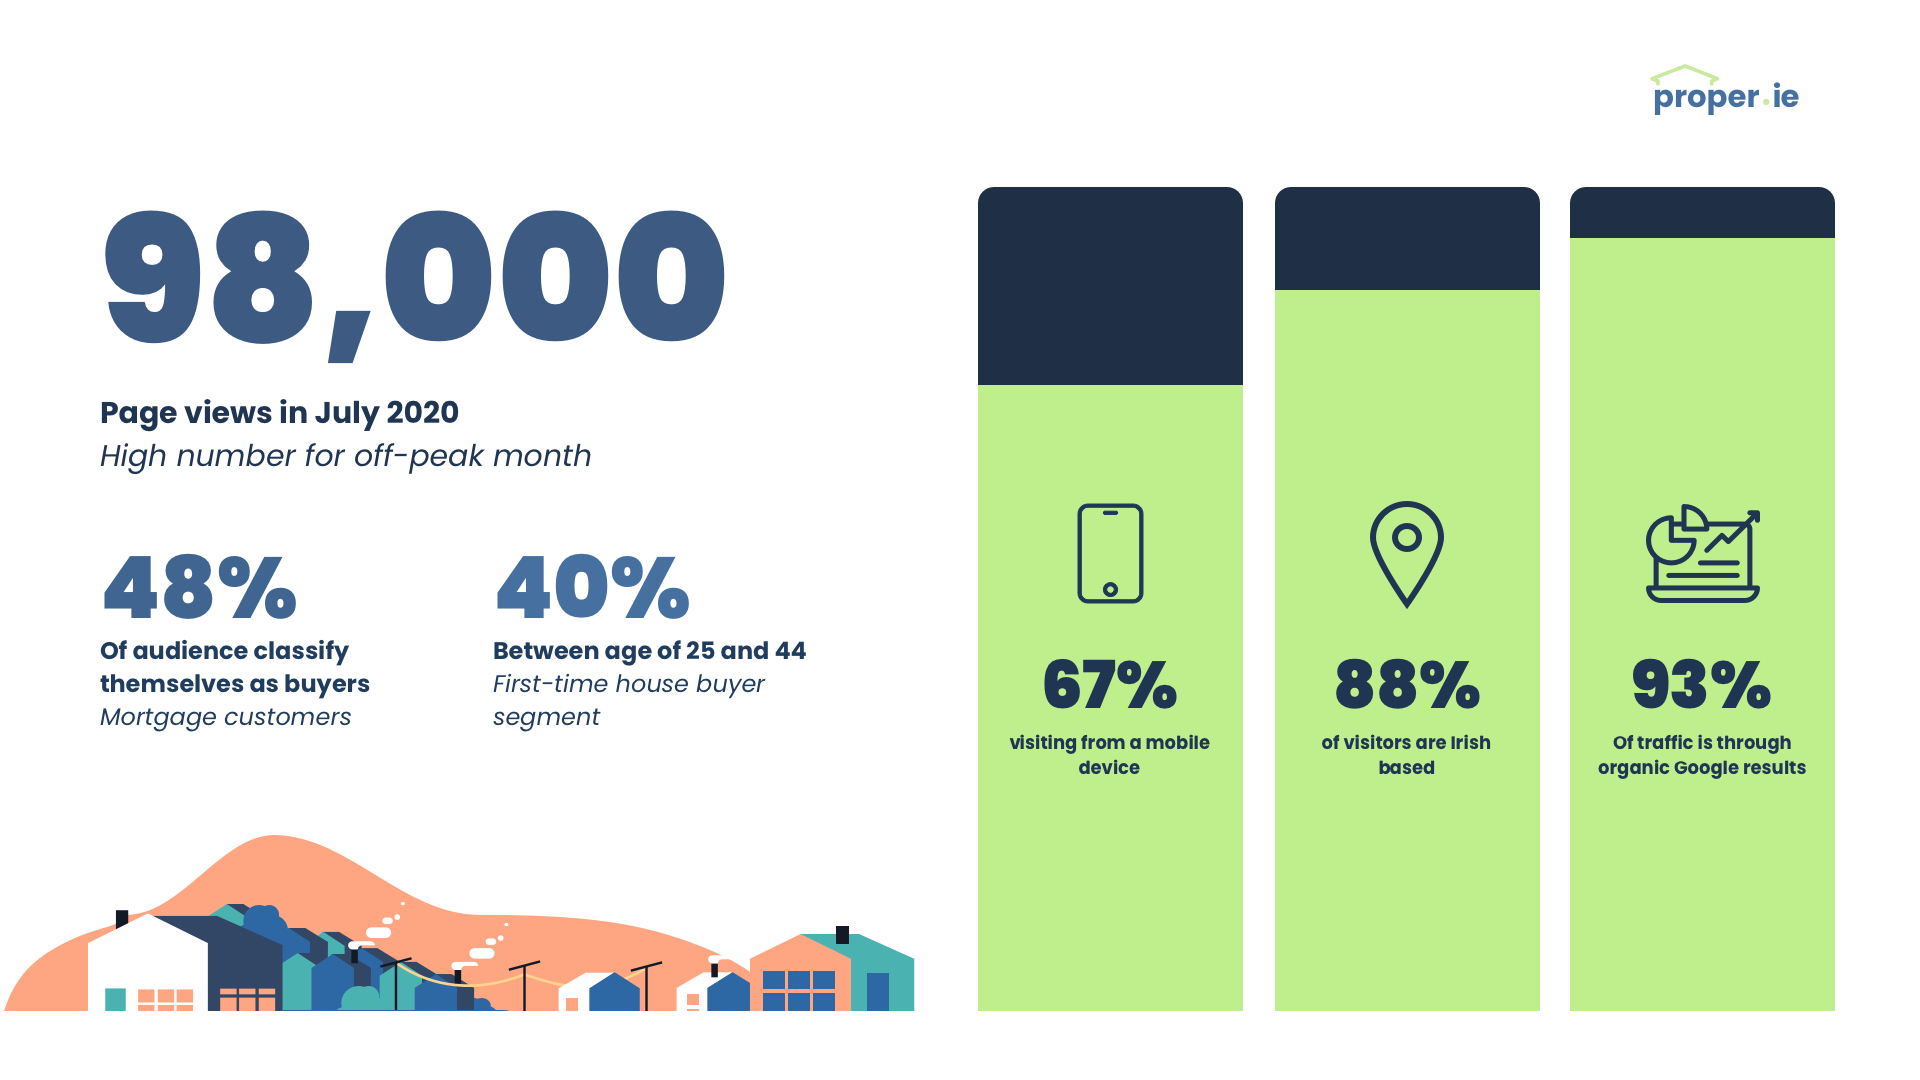
We also thought it would be good to get some feedback from the audience as to why they were visiting the site. We wanted to make this a very low-friction point of interaction to maximise the feedback we received, and devised the “Buying? / Selling? / Just Nosey?” survey panel that appears above the search results. The hit rate on this was high and we quickly found out that the majority of our audience were either buying or just nosey!

Driving Traffic

Towards the second half of 2019, we embarked on a project to enhance the site performance further with the specific goal of increasing organic traffic to the website. 

A key part of this was introducing Angular Universal as the technical framework for serving pages to the audience. This moved us away from the standard Angular approach where the application is executed in the browser, with pages rendered in the DOM in response to users’ actions.  

Angular Universal executes on the server, generating static application pages that later get bootstrapped on the client. This means that the application renders more quickly, giving users a chance to view the application layout before it becomes fully interactive. This is known to facilitate web crawlers and was likely to improve the application’s rank in search engines.

It also decreases page load time and improves performance on mobile devices. Both factors are rewarded by Google as they index the web and promote “better” sites in the search listings.

We also improved the structure of the HTML and started to submit sitemaps to the Google Search Console.

The impact was dramatic.

From an average of approximately 4,000 users per month up to and including November 2019, traffic started to grow significantly to a peak of 68,847 users in July 2020. We began to notice that we were appearing towards the top of search results for properties which had been sold in the recent past and had been added to the register. We are on track for 1.5 million page views in the 2020 calendar year and the trend remains upwards.

Next up ...

Further finetuning of the search tool will improve the way our audience finds properties of interest. We’re strong in returning exact matches of a specific address or area wide statistics. There is a middle ground between these where users enter free text entries to look for street level information. Based on the non-standardised way in which the data is entered, we need to add a semantic layer to spot differences and similarities in an intelligent way. 

The application is moving from a beta playground to a stable alpha, and we expect the traffic we are witnessing to grow further over the coming 12 months.  

We are now working towards making it the go-to place for property sales information in Ireland, both at the individual house level and at the broader area-based trend level. Not bad for something that started off as a space for our devs to tinker!